
Discounted Cash Flows Explained: A Step-by-Step Guide

You have a price in front of you this week. A seller wants a set sum for a small firm, or a manager wants sign-off on a line that will not repay its cost for years. The accounts show profit, yet profit next year is not cash you can spend today. Discounted cash flows turn that future cash into a figure you can set beside the price.
The method is simple to describe and easy to misuse. You forecast the cash, you choose a rate that reflects how the business is financed and how risky that cash is, and you bring each amount back to today. Shift the rate, or the assumption about cash after the forecast ends, and the answer moves. That movement is not a nuisance. It is the information. What follows builds the sum in small steps, with figures you can check by hand, and treats the rate and the long-run value as financing and scenario questions rather than one fixed number.
Table of Contents
- What Discounted Cash Flows Tell You
- Inputs That Set the Answer
- Choosing a Discount Rate That Reflects Financing
- How to Build a Discounted Cash Flow Model
- Worked Example From Forecast to Share Value
- Terminal Value and Scenario Testing
- Checking Your Model Before You Rely on It
What Discounted Cash Flows Tell You
A business that pays €100,000 a year for five years is not worth €500,000. At a 10% rate, those five payments are worth about €379,000 today. The first €100,000 is cut by one year of waiting, the second by two years, and so on. You can check it by hand: divide 100,000 by 1.10, then by 1.10 squared, then by 1.10 cubed, then by 1.10 to the fourth, then by 1.10 to the fifth, and add the five results.

A discounted cash flow valuation is an estimate of what a business, project or asset is worth today, based on the cash it is expected to generate and a rate that reflects the risk of receiving that cash.
Money received later is worth less than money held now, because today's money can be invested and future payments carry risk.
In plain notation, value equals each year's cash flow divided by (1 + rate) to the power of the year, added to the terminal value discounted the same way.
Readers usually meet discounted cash flows in three situations.
- A purchase. You are valuing a company or a stake before you buy.
- A capital project. You are asking whether a machine, a fit-out or a system repays its cost. That question belongs with capital budgeting, where the same present-value test decides go or stop.
- A share-price check. You are asking whether today's price looks high or low against the cash you expect.
The result is an estimate. It depends wholly on the forecast and the rate you choose. Discounted cash flows answer what future cash is worth to you today, not what the market will pay this week.
Inputs That Set the Answer
Seven inputs set the answer, and each one needs a source before you touch a formula. The table below lists them. Treat the figures in the third column as illustrative assumptions for a stable private firm; replace each one with the figures of the business in front of you.
| Input | Where the figure comes from | Illustrative range or example | Effect when it rises |
|---|---|---|---|
| Free cash flow to the firm | Cash flow statement, less capital expenditure and working capital build-up | €1.2 million in a steady year | Raises value |
| Forecast period | Business plan | Five years for a stable firm; ten years if still scaling | Raises value when later years are strong |
| Revenue growth | Historic trend, market data and management plan | About 2-5% for a mature firm; higher while share is being won | Raises value |
| Discount rate (WACC) | Cost of equity and after-tax cost of debt, weighted by each source's share of financing | Roughly 8-12% for an established private firm | Lowers value |
| Terminal growth rate | Long-run inflation plus real growth | About 1-3%, held below long-run nominal growth | Raises value |
| Net debt | Latest balance sheet: borrowings less cash | Borrowings of €4 million less cash of €1 million | Lowers equity value |
| Diluted share count | Latest accounts plus options and convertibles | Every instrument that could become a share | Lowers value per share |
The two inputs that compound
Free cash flow to the firm starts from operating cash rather than reported profit. Take the cash generated by operations, deduct capital expenditure, then deduct any extra cash absorbed by stock, debtors and creditors. A growing firm can post a healthy profit and still produce thin cash, because equipment spending and a larger working-capital balance soak up money before shareholders see it. The statement of cash flows shows that gap year by year, where the profit and loss account alone would hide it.
Revenue growth should survive three checks that broadly agree: the historic trend, what the market can absorb, and management's plan. A mature local service business often grows in low single digits. A firm still winning share can justify a faster rate, though only for the years in which that share is being won.
Why the rate and the end-growth dominate
The discount rate and the terminal growth rate usually move value more than any single year's sales figure, because both compound across every year, including the years after the forecast ends. Take the steady €1.2 million from the table. Discounted at 9% for five years it is worth about €780,000; at 11%, about €712,000. Same cash, same year, two different answers, and the gap widens over longer horizons.
That sensitivity is why one borrowed benchmark rate misleads. The right figure reflects how the firm itself is financed, and the end-growth reflects what it can plausibly sustain, so treat both as questions to test across scenarios rather than fixed points.
Net debt comes from the latest balance sheet at the valuation date, borrowings minus cash. With €4 million of borrowings and €1 million of cash, net debt is €3 million, and subtracting it converts enterprise value into equity value. The diluted share count must then include every option and convertible that could become a share; leave them out and value per share looks too generous.
The forecast period matters more for a fast-growing business than for a stable one. If the later years are much stronger than the early ones, a short forecast buries that cash inside a crude end-value. Stretch the explicit years until growth has settled.
Practical rule: Write each assumption next to its source, so a reviewer can challenge it line by line.
Choosing a Discount Rate That Reflects Financing
The discount rate is the input readers most often get wrong, because one tidy percentage hides several different debts. A loan signed three years ago, a facility up for renewal next March, and an overdraft that reprices every quarter each carry a different cost, and a single WACC sweeps them all into one number.
Build the weighted average
Weighted average cost of capital blends the return lenders require and the return shareholders require. Weight each by its share of total financing, and use the after-tax cost of debt, because interest reduces taxable profit.
Say the firm is financed 70% with equity at an 11% cost and 30% with debt at a 5.5% cost, and Irish corporation tax is 12.5%. The rate is 0.7 × 11% + 0.3 × 5.5% × (1 − 0.125), which is about 9.1%. Check the pieces by hand: equity contributes 7.7 points, and the after-tax debt slice contributes about 1.4 points.
The cost of equity is built from a risk-free rate, an equity risk premium, and the business's beta, which measures how sharply its returns move with the market. A small unlisted firm often deserves a higher equity cost than a large listed peer, because a buyer cannot sell the stake on a Tuesday afternoon. The cost of debt is the rate the business would pay on new borrowing today. The coupon on an old loan, signed when money was cheaper, only tells you what the firm used to pay. How much debt the firm can carry, and on what terms, is a capital structure choice, and that choice feeds straight into the weights.
One Irish rate does not fit every year
Irish SME borrowing has not sat still. The Central Bank of Ireland's SME lending statistics show new SME lending priced at 5.59% in Q2 2026, while outstanding SME loans stood at 4.96%, and new-lending rates rose 44 basis points within the quarter. The gap between those figures matters: the average cost of what the firm already owes and the marginal cost of what it would borrow next are different numbers, and both keep moving. A rate copied from one quarter can be wrong for the rest of the forecast.
Separate four things instead of forcing one rate across every year.
- Existing debt. Price it at the rate already contracted, until that contract ends.
- New debt. Price fresh drawdowns at the marginal rate the firm would be offered now.
- Refinancing dates. When a facility matures, switch the rate from the old coupon to the rate you expect on the renewal.
- Floating-rate exposure. If the margin is fixed but the base rate moves, the cash interest cost moves with it. Do not bury that inside a single WACC and forget it.
Higher financing costs do more than nudge enterprise value down through a higher WACC. They shrink debt capacity, they change the interest line in the cash forecast, and they reach the end-value too, because the rate discounting those distant cash flows is no longer the rate that financed the early years. That is why the discount rate is a financing question before it is a valuation one. You are asking what the firm's money will cost, year by year, under the scenario you are testing.
Where the rate changes over the forecast, record the date each rate applies to. A time-varying rate matched to each financing event is more realistic than one current market rate painted across the whole model. Two analysts can both pick 9.1% for year one and still land far apart by year five, and an honest model shows exactly why.
How to Build a Discounted Cash Flow Model
A spreadsheet routine keeps the judgement in the assumptions and the arithmetic in the cells. Do the steps in this order.
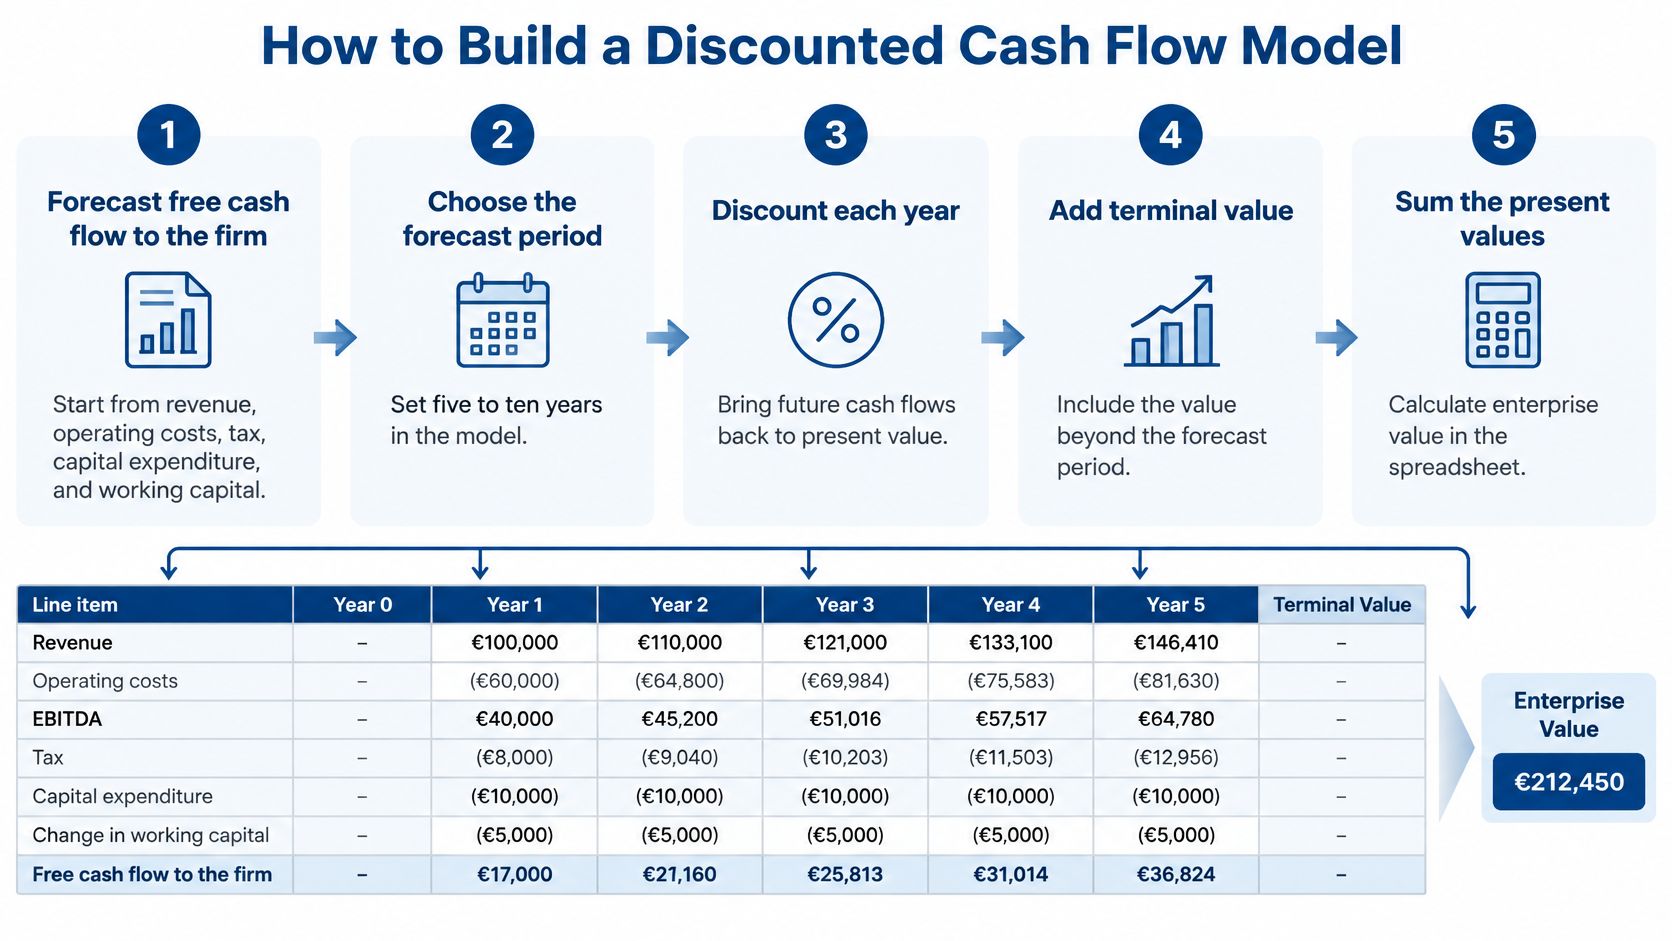
The six steps
Forecast free cash flow to the firm for five to ten years. Start from revenue, take off operating costs and tax, then deduct capital expenditure and the change in working capital. You do this first because every later number hangs off that cash. A common mistake is to drop in net income. Profit ignores money spent on assets and money absorbed by stock and debtors, so the cash figure is the one that can be discounted.
Estimate the discount rate. For cash flows that belong to both lenders and shareholders, that rate is usually the weighted average cost of capital. Match the rate to the cash. A rate built for equity holders will mis-price cash that still has to service debt.
Discount each year. Divide that year's cash flow by (1 + rate) raised to the year number. Year 3 is divided by the rate compounded three times, not once. This goes wrong when the same factor is applied to every year, which flatters the distant cash.
Estimate terminal value. Cash does not stop when your forecast stops. Use a long-run growth rate of about 2-3%, or an exit multiple on a final-year figure. Keep growth at or below long-run nominal growth of the economy the firm sells into. Watch for a heroic growth rate here: it assumes the firm outgrows the economy forever, and no firm does.
Discount the terminal value back to today with the same compounding as step 3. A large end-value that sits at year 10 is a claim on year-10 cash, so it counts toward today's figure only after being compounded back across those ten years. Forgetting this discount is the fastest way to double the answer.
Reach value per share. Add the present values to get enterprise value, subtract net debt, and divide by the diluted share count. Enterprise value is the whole firm. Equity value is what is left after debt. Dividing enterprise value by the share count and calling that a share price gives debt holders' money to shareholders on paper.
If you value equity directly, discount free cash flow to equity at the cost of equity instead. That cash is already after interest and debt repayments, so skip the net debt deduction in step 6. Mixing the two, equity cash with a WACC, or firm cash with a cost of equity, counts debt twice or not at all.
A clean financial model makes each of those steps a separate block, so a colleague can see which cell is a forecast and which cell is arithmetic.
A sense check before you trust the total
Change one input and watch the result. A higher rate should lower value. Faster growth should raise it. If the model moves the wrong way, a sign is flipped. Then look at how much of enterprise value sits in the terminal value. A large share is normal. A large share you cannot explain in one sentence is a warning. Say what has to stay true for that end-value to be earned, in words a non-specialist would accept.
Worked Example From Forecast to Share Value
Take a five-year forecast and a rounded 10% rate so the arithmetic can be checked without a calculator's hidden rounding. These cash flows are a teaching case for checking mechanics.
| Year | Free cash flow (EUR m) | Discount factor at 10% | Present value (EUR m) |
|---|---|---|---|
| Year 1 | 1.0 | 0.909 | 0.909 |
| Year 2 | 1.2 | 0.826 | 0.991 |
| Year 3 | 1.3 | 0.751 | 0.976 |
| Year 4 | 1.4 | 0.683 | 0.956 |
| Year 5 | 1.5 | 0.621 | 0.932 |
| Sum of Years 1 to 5 | 4.764 | ||
| Enterprise value | 16.64 |
From each year to the five-year sum
Multiply cash by the factor. Year 1 is 1.0 × 0.909 = €0.909 million. Year 2 is 1.2 × 0.826 = €0.991 million. Year 3 is 1.3 × 0.751 = €0.976 million. Year 4 is 1.4 × 0.683 = €0.956 million. Year 5 is 1.5 × 0.621 = €0.932 million.
Add those five present values and the explicit forecast gives €4.764 million, or €4.76 million rounded. That is only the visible part of the forecast. Most of the firm still sits beyond year 5.
Terminal value, then equity
Grow the year 5 cash flow by 2% for one year: 1.5 × 1.02 = 1.53. Divide by the gap between the discount rate and that growth rate, 10% minus 2%, which is 0.08. The result is 1.53 / 0.08 = €19.13 million at the end of year 5.
Bring that back with the year 5 factor: 19.13 × 0.621 = €11.88 million in current money.
Enterprise value is the five-year sum plus that present value: 4.76 + 11.88 = €16.64 million. About 71% of it comes from the terminal value.
Subtract €2.0 million of net debt. Equity value is €14.64 million. Divide by the diluted share count. If that count is 1 million shares, value per share is €14.64. Use the diluted count from the latest accounts, including options that could become shares.
Treat the 10% as a teaching rate rather than a permanent setting. For an Irish SME whose facilities reprice at renewal, the financing case can shift while the operating forecast stays the same, so one rate can hide the question that matters. The 71% share is the figure to challenge first: it depends on the growth rate, the discount rate, and the story that keeps both believable after year 5.
Terminal Value and Scenario Testing
One discount rate and one growth assumption produce exactly one answer, and a single answer is easy to over-trust. A valuation is better treated as a small set of defined cases, each with its own inputs, so anyone reading the model can see which assumption does the work and what the value becomes when that assumption turns out wrong. Moving the discount rate from 10% to 11%, or terminal growth from 2% to 1%, changes the result materially, because each move widens or narrows the gap that divides the terminal cash flow. Define the cases first, then run the numbers.
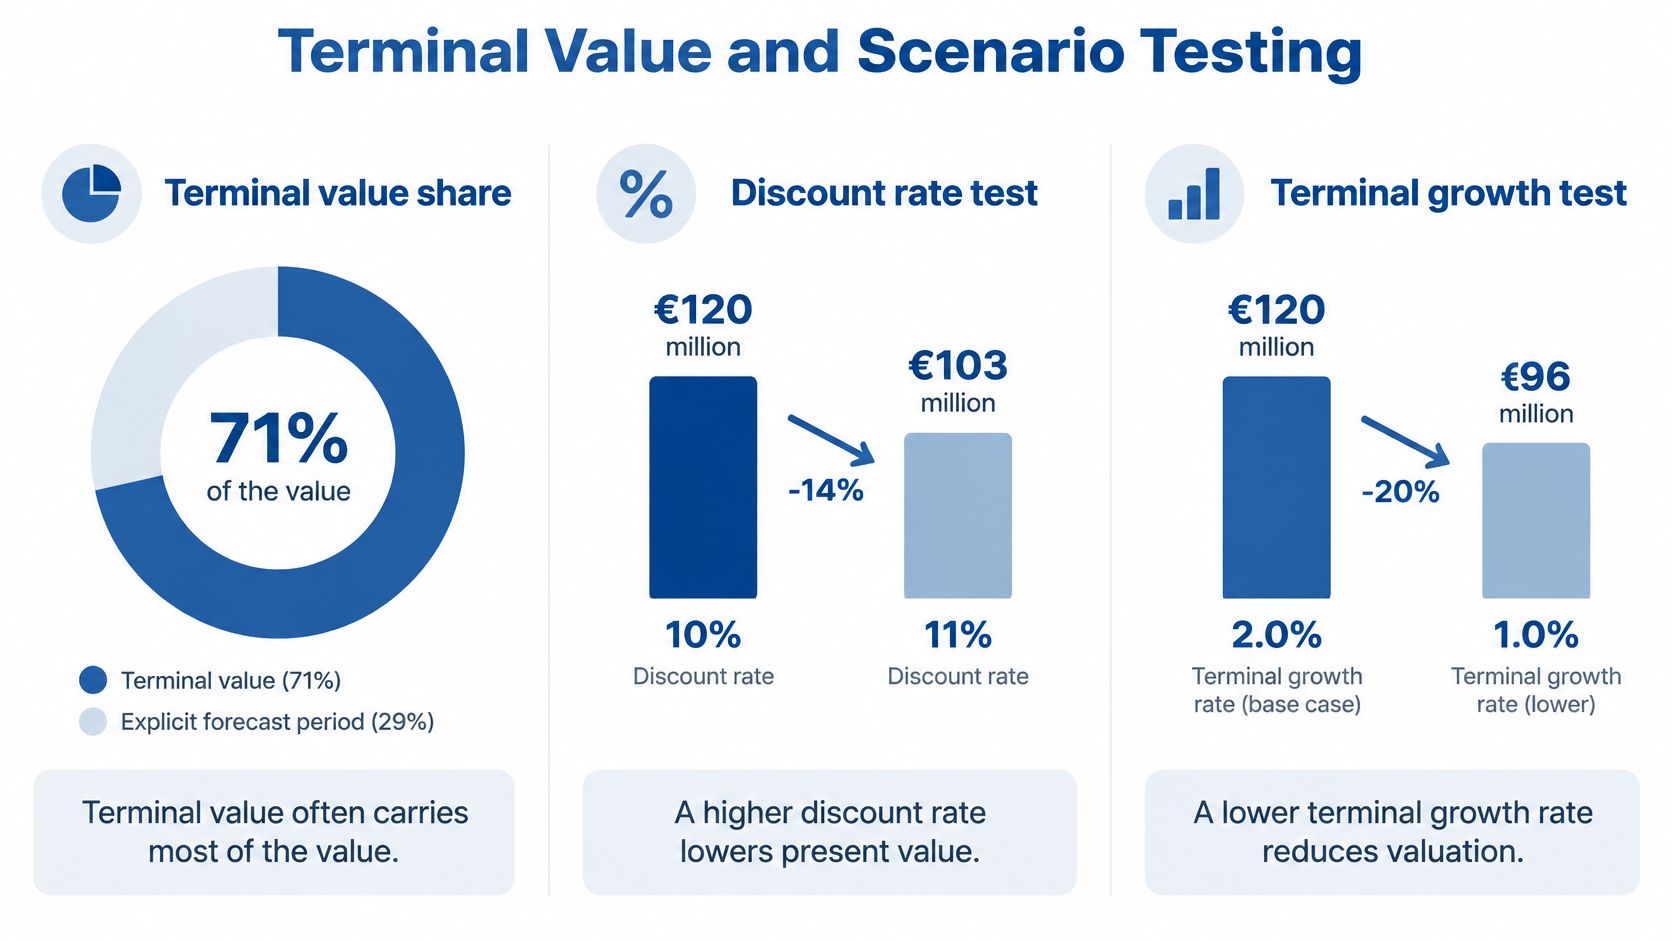
Three cases, each with its own inputs
Base case. Use management's plan for revenue, margin, capital expenditure and working capital. Match the financing rate to facilities already signed, and keep terminal growth inside long-run nominal growth. This is the case you defend in a meeting, not the case that makes the price work.
Downside case. Slow the revenue path and raise capital expenditure, for example because equipment has to be replaced sooner. Leave base-case financing alone unless the downside itself forces a covenant breach or a cash shortfall. Change only the inputs you named. If everything moves at once, you cannot see what hurt the value.
Refinancing case. Debt matures and is replaced at a higher rate. Update interest in the cash flows, update the discount rate from the refinancing date, and check whether the firm can still carry the same debt. Working capital still needs funding, so a higher rate on the same drawings can turn a comfortable facility into a constraint.
Run the model end to end at each case and keep all three outputs. Do not publish the middle figure and file the rest.
Climate cash, not a fudge to the rate
Climate effects belong in the cash flows and the financing terms, not in a vague comment beside the valuation. Model retrofit spending, energy-cost savings, carbon-related operating risks and any green-finance benefit as separate lines. An asset-stranding case, where a site or a fleet loses useful life, is its own scenario. Timing matters too. Spend the retrofit early and the savings arrive later; miss the eligibility rules and the cheaper finance never appears.
The Central Bank of Ireland's climate-related financial disclosures report that its sustainable debt holdings grew from €450 million in 2020 to €2.0 billion at the end of 2025, with a further target of €2.25 billion by 2027. AIB has reported that green and transition lending now accounts for a large share of its new lending. For an Irish firm weighing a retrofit, the terms on green finance are a live input rather than a footnote.
Do not double count. Cutting the discount rate for sustainability risk while also dropping optimistic green-finance savings into the cash flow counts the same benefit twice. Pick one home for each effect: a risk or a saving lives either in the forecast or in the rate, never in both.
Present a value range, and name the scenario that produces each end. A single figure pretends the financing path and the climate path were known in advance.
Checking Your Model Before You Rely on It
Act on the valuation only when the base case is plausible, the downside case still clears your hurdle rate, and the terminal value can be explained in plain words.
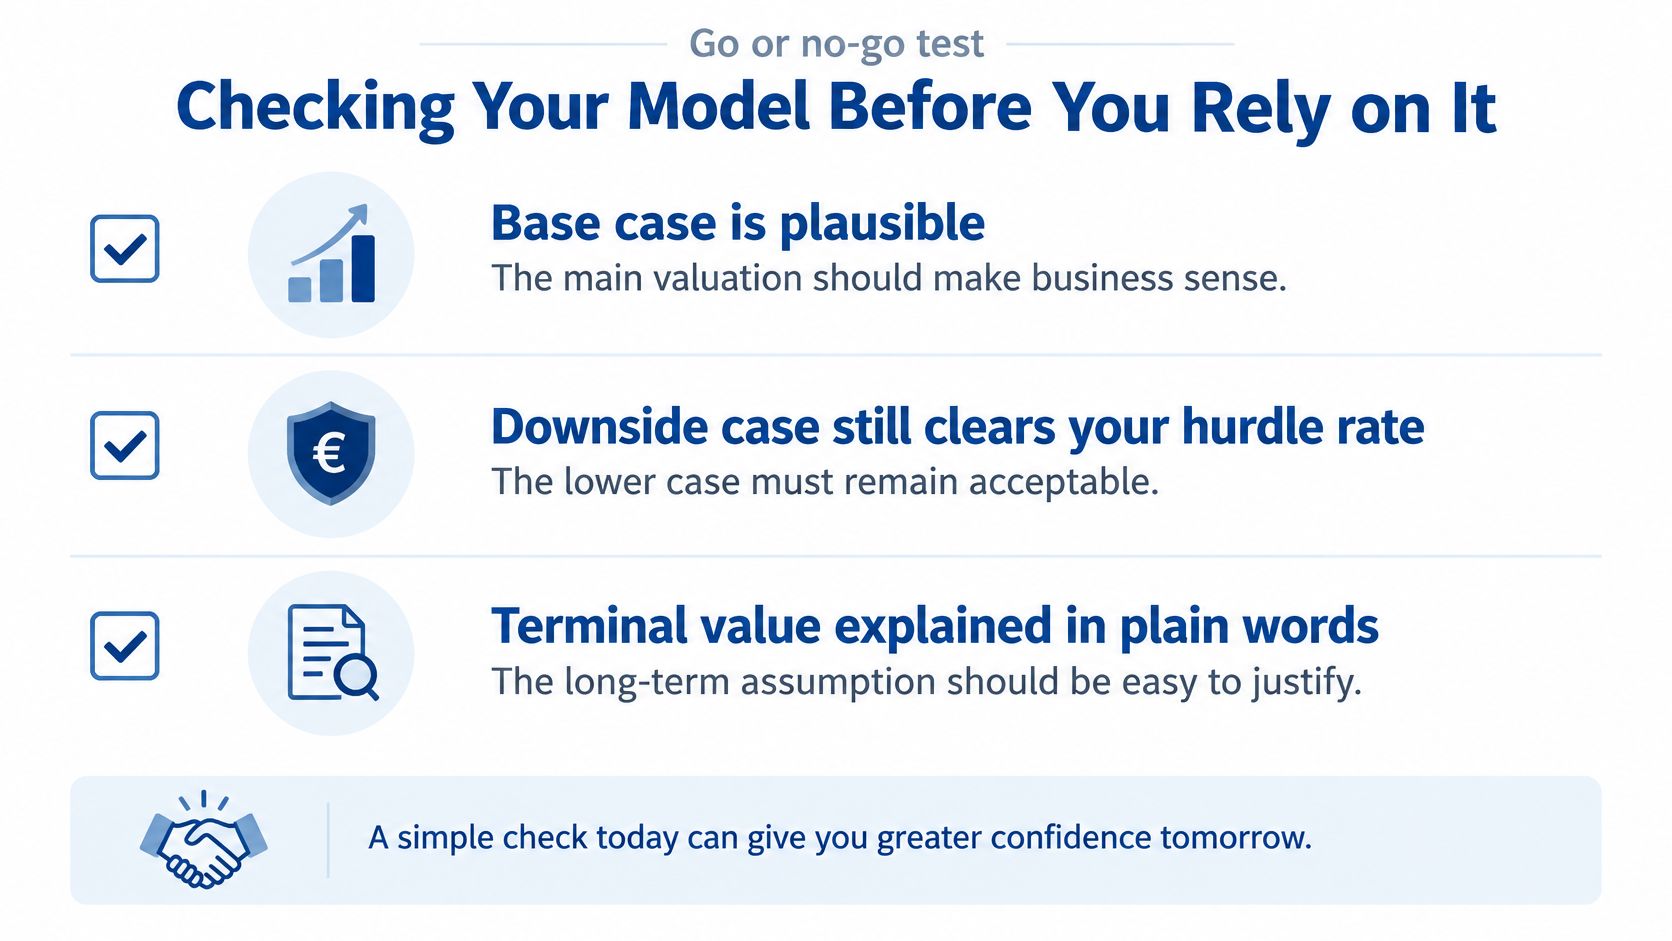
Walk the checks in this order. Earlier faults make the later ones meaningless.
- Net income standing in for free cash flow. Profit skips capital expenditure. A firm that must keep buying assets is overvalued the moment you treat accounting profit as cash.
- Working capital ignored. Growth soaks up cash in stock and unpaid invoices. Leave that out and a scaling firm looks richer than its bank balance.
- Terminal growth above long-run nominal growth. The firm then outgrows the economy forever. Pull the rate back.
- Mixed inflation. A cash forecast in current prices, discounted at a rate that includes inflation, understates value. Keep both sides nominal, or both sides real.
- Historic debt cost. The coupon on an old loan is not the marginal cost of the next euro borrowed.
- A risk or a benefit in both places. If carbon cost is already in the cash flows, do not also punish it inside the rate.
- Stale net debt or an old share count. Use the valuation date. Options granted last month still dilute.
Rebuild the model in a spreadsheet. Have a second person check each input against its source. Record the date and the source of every assumption, so the valuation can be updated when rates or forecasts change. The Mini-MBA Financial Management Programme from European Institute of Leadership and Management covers financial concepts, accounting principles, investment fundamentals, economics, and international business, which is a structured way to practise this judgement before a live deal depends on it.
European Institute of Leadership and Management offers self-paced online courses and Mini-MBA programmes in financial management, accounting and business administration for managers who need to read a valuation rather than take it on trust. Those programmes connect the cash-flow forecast, the financing rate and the end-value test covered here with the wider job of running a firm. Visit European Institute of Leadership and Management to see the financial management pathway and start with the topic you need next.