
Debt to Equity Ratio Formula: How to Calculate and Read It

Debt-to-equity ratio = total debt ÷ shareholders' equity. The result is a multiple, so 1.5 means one and a half euro of debt for every euro of equity.
A business owner preparing a loan application may have the balance sheet open and a calculator ready, yet still be unsure which liabilities to count. The bank loan seems obvious. Supplier invoices, a vehicle lease and money lent by a director are less straightforward.
The most important decision is what counts as debt. A useful calculation names that choice clearly, rather than presenting a precise-looking result without explaining its contents.
Table of Contents
- What the Debt to Equity Ratio Tells You
- Which Liabilities Belong in the Numerator
- How to Calculate Debt to Equity in Four Steps
- Worked Example for a Mid-Sized Company
- Reading the Result Across Different Ratios
- Misreadings That Distort the Ratio
- Calculate Your Own Ratio and Show Both Versions
What the Debt to Equity Ratio Tells You
debt-to-equity ratio = total debt ÷ shareholders' equity
A house bought partly with a mortgage and partly with savings offers a useful analogy. The ratio compares the lender's contribution with the owner's contribution, not the mortgage with the house's entire value.
Business financing works similarly, although accounting equity isn't necessarily the same as the cash owners originally invested. Debt represents amounts owed to lenders and, under the broader definition, other creditors. Shareholders' equity is the owners' accounting claim on assets after liabilities have been deducted.

Both figures come from the balance sheet at the same reporting date. Their relationship describes the company's capital structure, meaning its mix of creditor financing and owners' funds.
For illustration, a multiple of 1.5 can also be written as 150%. These aren't different results, merely different ways of expressing the same relationship.
What a higher or lower result suggests
A higher ratio generally indicates greater reliance on creditors relative to the equity cushion. Where the numerator consists of borrowing, that can mean greater exposure to interest costs and repayment pressure.
A lower ratio usually indicates a larger equity cushion relative to the obligations counted. It doesn't prove that cash is available to pay the next bill, and it doesn't establish whether management has chosen an efficient funding mix.
The ratio is a financing snapshot, not a measure of profitability or an assurance of financial health. Its usefulness starts with a clear definition of the numerator.
Which Liabilities Belong in the Numerator
The debt to equity ratio formula supports two defensible calculations. Interest-bearing debt divided by equity focuses on financing structure; total liabilities divided by equity gives a broader view of balance-sheet solvency.
The balance sheet contains both borrowing and operating obligations. Treating every liability as a bank loan blurs that distinction.
Balance sheet items and how each version treats them
| Balance sheet item | Total liabilities version | Interest-bearing debt version | Note |
|---|---|---|---|
| Bank term loans | Include | Include | Core borrowing in every version |
| Overdrafts and revolving credit | Include | Include | Short-term but interest-bearing |
| Lease liabilities | Include | Usually include | Recognised financing obligations with scheduled repayments |
| Director and shareholder loans | Include | Include if interest-bearing | Often informal; check the loan terms |
| Trade payables | Include | Exclude | Operating liability settled in the normal course |
| Accruals and deferred income | Include | Exclude | Operating timing items |
| Pension obligations | Include | Exclude unless treated as borrowing | Often disclosed separately |
| Deferred tax liabilities | Include | Exclude | Non-cash balance |
Bank term loans belong in both versions. Overdrafts and revolving facilities also belong, even when management expects to repay them shortly.
Recognised lease liabilities usually belong in the financing calculation because the business has scheduled payment obligations. Excluding them can make an asset-heavy business appear less dependent on financing than it really is.
Director and shareholder loans require closer reading. An interest-bearing loan belongs in the narrow version; an interest-free loan with enforceable repayment terms should still be disclosed separately when assessing refinancing pressure.
Operating liabilities need a different interpretation
Trade payables and accruals arise through normal trading rather than conventional borrowing. Deferred income represents obligations associated with amounts received before revenue is earned, while deferred tax isn't a priced loan.
Pension obligations warrant separate attention because their funding implications can be significant without resembling ordinary bank debt.
Practical rule: Report both versions, name each definition and reconcile every included balance to the accounts.
The reconciliation should identify bank borrowing, leases, shareholder funding and trade creditors separately. That makes the calculation auditable and prevents an informal funding arrangement from disappearing inside a broad total.
How to Calculate Debt to Equity in Four Steps
A spreadsheet with separate columns for the balance-sheet label, amount and inclusion decision is sufficient. Keeping the original labels makes checking easier than copying isolated figures into a calculator.
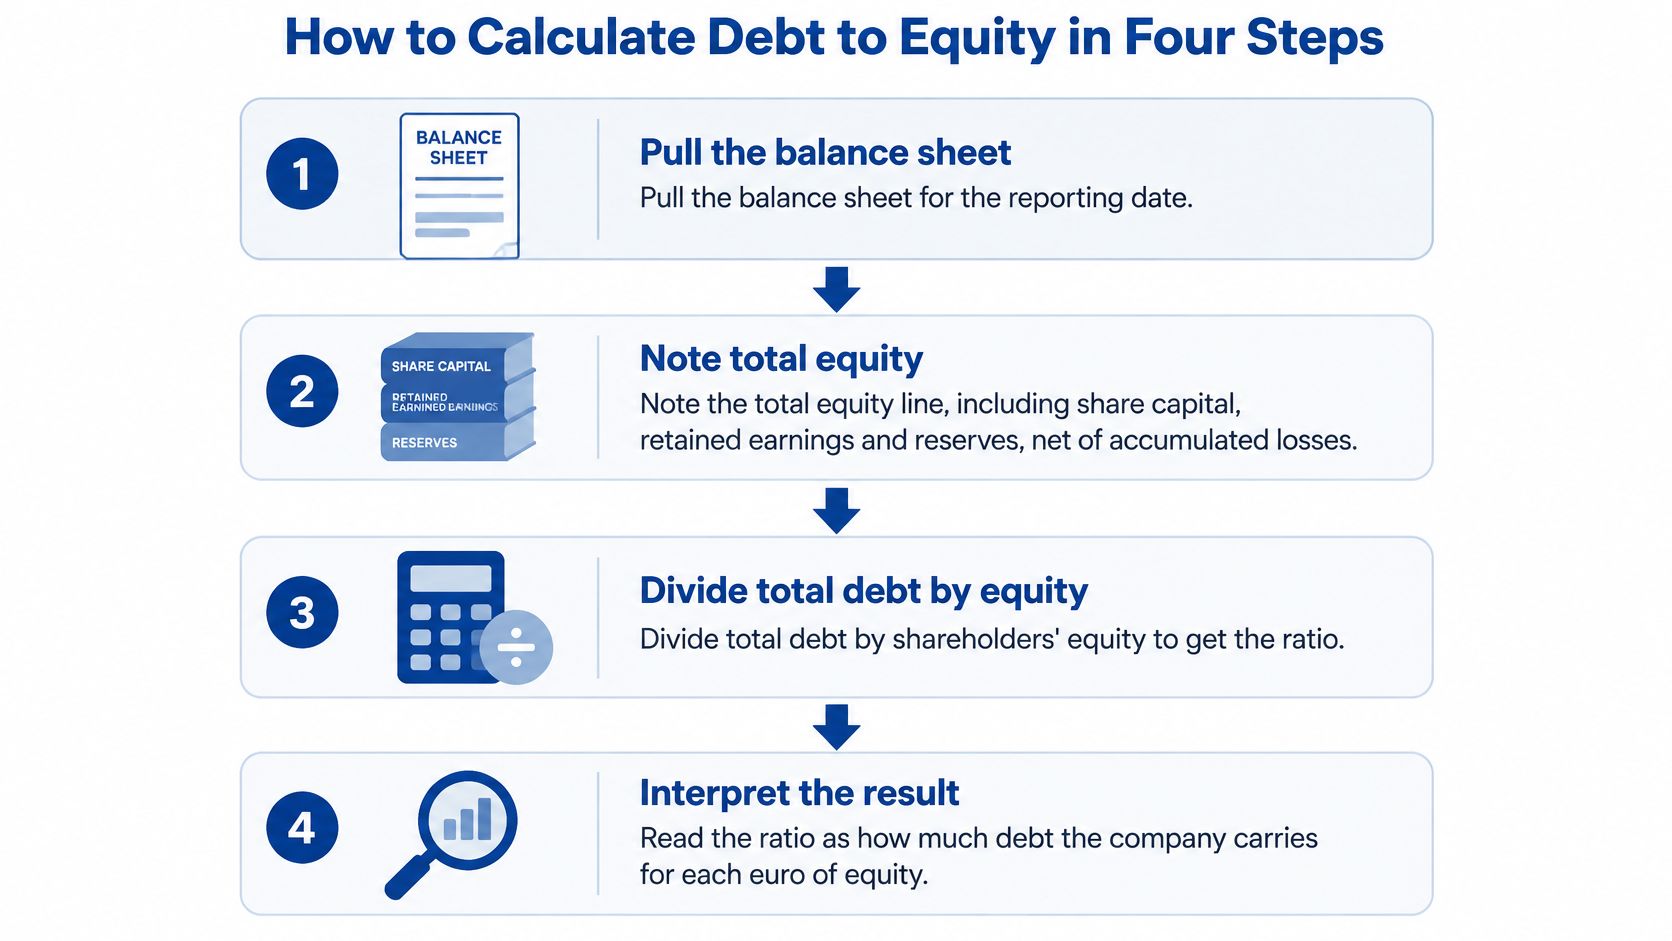
Pull the balance sheet and identify total equity. Use the reporting-date equity total, including share capital, retained earnings and reserves, net of accumulated losses. Taking share capital alone misses profits retained in the business and other equity movements.
Choose and assemble the debt figure. Apply the liability rules consistently, either taking total liabilities or adding the selected financing balances. Total assets aren't a substitute for debt, and a subtotal mustn't be added again if its component balances are already included.
Divide debt by shareholders' equity. Both amounts must use the same date, currency and reporting scope, such as the same company or consolidated group. Mixing year-end borrowing with interim equity produces a result that describes neither reporting position accurately.
Present the answer as a clearly labelled multiple. For illustration, a result of 1.75 may be displayed as 175%, with the multiple rounded to two decimal places. The label should identify the numerator so another reader can reproduce the answer.
Check the accounting before judging the result
The basic reconciliation is:
Total assets − total liabilities = shareholders' equity
A mismatch often means that a figure came from the wrong line, a component was omitted, or amounts from different statements were combined. Display rounding can also cause small differences, so the underlying figures should be checked before treating a discrepancy as an accounting problem.
Currency units deserve attention too. Accounts presented in thousands mustn't be combined with borrowing schedules expressed in whole euro without conversion.
Zero equity prevents division, while negative equity requires a different assessment rather than a standard debt-to-equity comparison. Very small positive equity also warrants caution because modest accounting changes can move the ratio sharply.
A sensible first-pass output isn't just a number. It records the numerator definition, debt amount, equity amount, reporting date and currency beside the result, with enough detail for another person to repeat the calculation.
Worked Example for a Mid-Sized Company
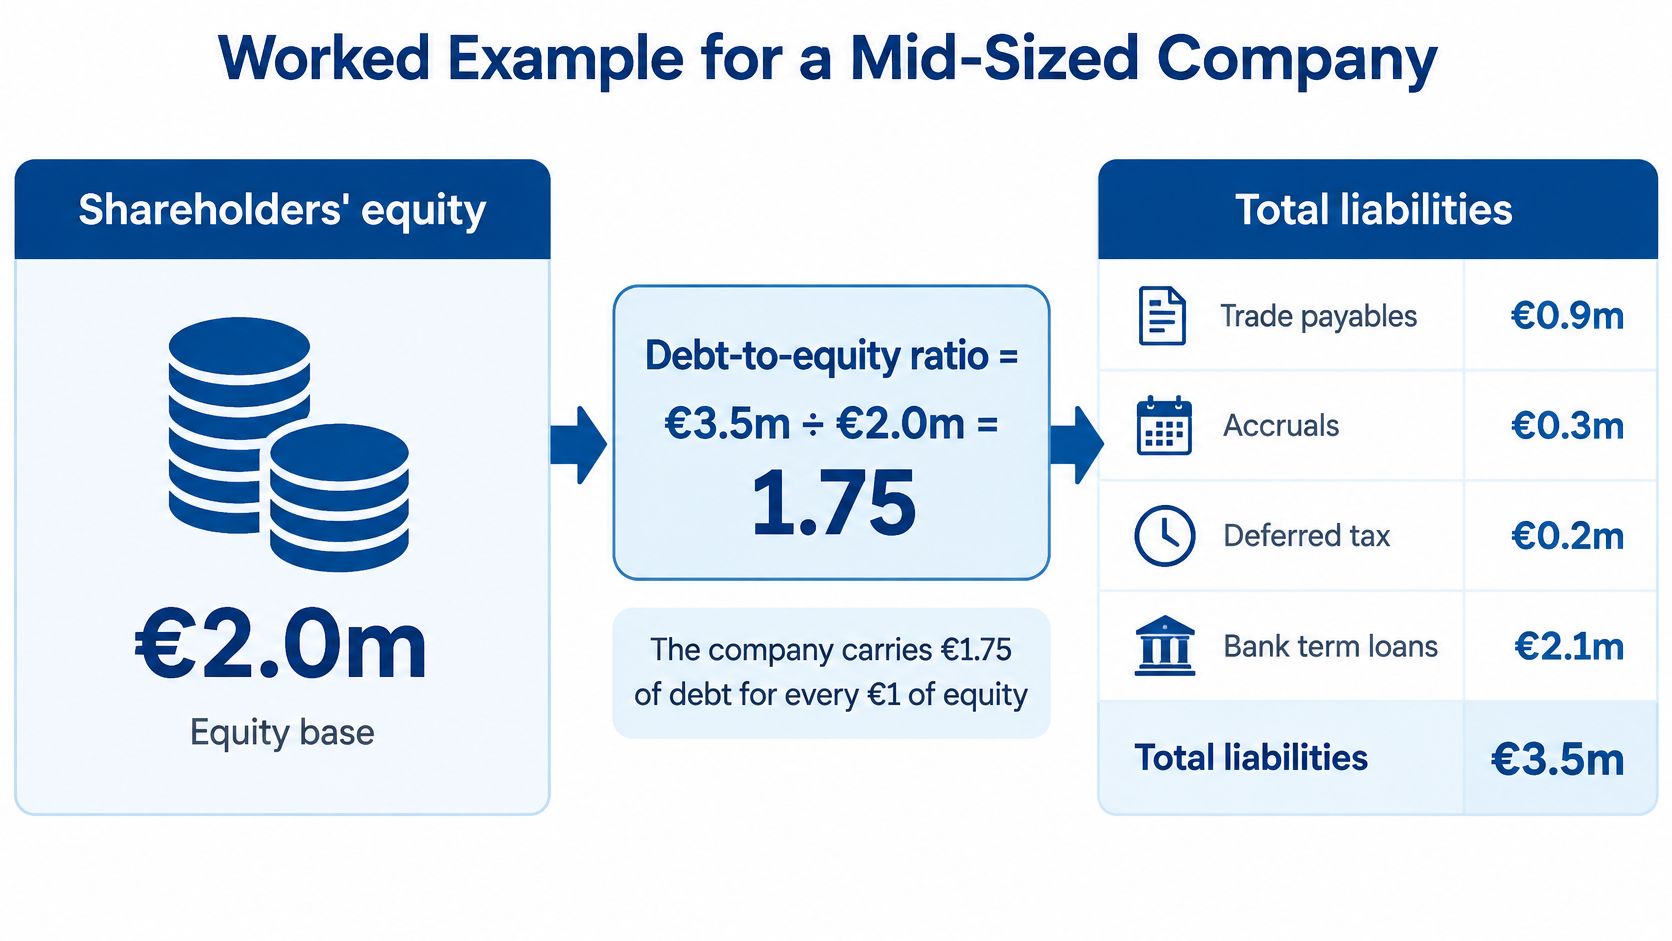
Consider a hypothetical mid-sized company with €2.0m of shareholders' equity and €3.5m of total liabilities. Its liabilities comprise trade payables of €0.9m, accruals of €0.3m, deferred tax of €0.2m, bank term loans of €1.6m, an overdraft of €0.2m and lease liabilities of €0.3m.
The amounts add to the stated liabilities total. The example assumes the lease liabilities are included in financing debt and that no director or shareholder loans are outstanding.
Compare the calculations
Using total liabilities, the calculation is €3.5m ÷ €2.0m = 1.75. This compares every recognised liability with the equity base.
Using interest-bearing debt including leases, the numerator becomes €1.6m + €0.2m + €0.3m = €2.1m. Dividing that amount by €2.0m gives 1.05.
Removing leases leaves bank loans and the overdraft of €1.8m. The resulting calculation is €1.8m ÷ €2.0m = 0.90.
Same balance sheet, three debt-to-equity results
| Version | Debt used in this hypothetical example | Equity | Result |
|---|---|---|---|
| Total liabilities | €3.5m | €2.0m | 1.75 |
| Interest-bearing debt | €2.1m | €2.0m | 1.05 |
| Interest-bearing debt excluding leases | €1.8m | €2.0m | 0.90 |
Explain the gap before drawing a conclusion
The broad result is higher because it includes operating payables, accrued costs and deferred tax alongside financing obligations. Those balances matter, but their settlement patterns and economic characteristics aren't identical to a priced loan.
The financing result isolates borrowing and recognised leases. A lender assessing repayment capacity may focus on that version alongside cash flow, although the loan agreement's own definition must govern any covenant calculation.
The lease-excluding result is useful as a comparison, not as permission to disregard lease payments. It demonstrates how removing a single category changes the apparent financing position without changing the company's obligations.
A defensible presentation names the method rather than selecting the lowest result. The practical exercise is to rebuild these calculations from the business's own liability schedule and explain every difference between them.
Reading the Result Across Different Ratios
Debt to equity bands and what they usually signal
| Ratio (multiple) | Usual reading | What to check next |
|---|---|---|
| Below 0.5 | Mostly equity-funded; low financial leverage risk | Whether available cash and growth opportunities justify borrowing |
| 0.5 to 1.0 | Relatively balanced mix of debt and equity | Interest cover and debt maturity dates |
| 1.0 to 2.0 | Debt-heavy but potentially compatible with asset-intensive operations | Cash flow and whether borrowing is fixed-rate |
| Above 2.0 | High reliance on borrowing and greater exposure to rate rises | Interest cover, loan covenants and refinancing dates |
| Negative equity | Ratio not meaningful because liabilities exceed assets | Solvency position and going-concern notes |
These are illustrative rules of thumb, not validated approval thresholds. Their interpretation also changes with the numerator used.
Property, utilities and transport businesses can support financing structures unlike those of software or professional-services firms. Comparisons work best among businesses with similar assets, revenue patterns and accounting policies.
Test affordability rather than relying on the band
In the hypothetical example, a one-percentage-point rate increase across all €2.1m of financing debt would add approximately €21,000 annually. That calculation assumes every included balance reprices for a full year; actual exposure should be tested facility by facility.
Comparing the extra expense with operating profit reveals whether the business has room to absorb it. Interest coverage, considered alongside other financial statements and ratios, adds an affordability test that debt-to-equity lacks.
Lender choice matters in Ireland. Central Bank of Ireland analysis reports that non-banks charge approximately 1.6–2.8 percentage points more than domestic banks for general non-household loans.
For the future-dated September 2026 scenario, treated here as a projection rather than a current observation, the Central Bank retail interest-rate figures place the weighted average rate on new lending to Irish non-financial corporations at 4.70%, against 5.18% for new lending by domestically focused banks.
A higher ratio funded through long-term fixed-rate borrowing may create less immediate pressure than a lower ratio backed by short-term floating-rate facilities. Tracking the business over three to five years is a useful analytical practice, with changes explained through borrowing, profits, losses and distributions rather than judged against a band alone.
Misreadings That Distort the Ratio
A mathematically correct answer can still support a poor decision. The most useful corrections address what the calculation leaves unclear.
Comparing unlike numerators. A total-liabilities result and a financing-debt result aren't interchangeable. Every comparison should carry a definition, with material exclusions visible beside the number.
Treating negative equity as ordinary debt. A negative denominator can produce a negative answer that appears smaller than a positive ratio. That ordering has no useful economic meaning; the analyst should examine accumulated losses, distributions, liquidity and going-concern disclosures instead.
Accepting a flattering reporting-date snapshot. Management may repay short-term facilities immediately before year-end and draw them again afterwards. Average borrowing balances, seasonal peaks and subsequent movements provide a better picture where available.
Ignoring obligations outside recognised liabilities. Guarantees and some contractual commitments may appear in the notes rather than the liabilities total. Their potential cash demands need consideration before the business is described as lightly financed.
Mixing book and market equity. Balance-sheet equity reflects accounting records, while listed-company market equity reflects share prices. A comparison becomes unreliable if one company uses book equity and another uses market value without explanation.
A short review before relying on the answer
The limitations of financial statement analysis matter most when a single ratio is used to justify borrowing or investment. The remedy is a transparent calculation paired with relevant context, not a more elaborate decimal result.
A final review should answer four questions: Which liabilities were included? Which reporting date was used? Which peers were compared? What does the trend show? Missing answers indicate that the interpretation needs more work, even when the arithmetic is sound.
Calculate Your Own Ratio and Show Both Versions
A repeatable process turns an isolated calculation into a management tool. The working paper should preserve the source figures and explain the judgement behind each inclusion.
Collect the last two balance sheets. Keep the accompanying notes, borrowing schedules and lease disclosures with them. These documents help distinguish a genuine financing change from a presentation change.
Calculate both numerator versions, using a separate reconciliation for each. A consistent worksheet should show included balances, exclusions and any classification decisions about shareholder funding.
Select three to five comparable peers as a practical starting sample. Similar sector, operating model and accounting basis matter more than collecting a large but mismatched group.
Plot the available trend and record the interest rate and repricing terms for each debt line. Changes should be annotated with their cause, such as expansion borrowing, retained profits or owner distributions.
Prepare a lender-ready reconciliation. Present the financing-debt version with its underlying balances, then apply any different definition specified in the lender's documentation rather than assuming the standard worksheet is sufficient.
Make the output decision-ready
Repeating the exercise each reporting year helps managers recognise which movements deserve attention. The purpose isn't to push the result towards an arbitrary target, but to support a decision about funding, repayment or further investigation.
Success is a one-page note showing both ratios, the figures behind them, the peer comparison and the decision supported by the analysis. Supporting schedules can sit behind that page so the explanation remains readable without sacrificing accuracy.
The European Institute of Leadership and Management offers self-paced online education in financial concepts, accounting and financial management, including financial-ratio analysis. Managers seeking structured practice with debt use and balance-sheet interpretation can visit the European Institute of Leadership and Management to explore relevant courses and programme pathways.