
What Is WACC and How to Calculate It
A spreadsheet is open, a case study is due, and one cell is waiting for a discount rate. A tutor wants a single percentage by Friday, or a project proposal has arrived with a rate nobody has justified.
WACC is the average annual rate a company must earn on its investments to satisfy the people who fund it, weighted by how much each source contributes. In practice it lands in a band rather than on a point, which is why regulated infrastructure and small business borrowing can sit far apart in the same economy.
A WACC is a range built from judgement calls about weights, rates and tax, and two analysts can differ by a percentage point without either being wrong. Those choices matter because a project can look worth funding at the low end and marginal at the high end.
Useful estimates make the judgements visible. They show where the answer moves when the mix of funding changes, when borrowing costs are reset, or when the tax assumption is challenged, and they test whether the decision still survives at the edge of the range. That makes the range part of the answer.
Table of Contents
- What WACC Means in Plain Terms
- The Formula and the Three Inputs Behind It
- Estimating Equity and Debt Costs in Practice
- How to Calculate WACC Step by Step
- Using WACC to Judge Investments and Valuations
- Where WACC Estimates Go Wrong and How to Check It
What WACC Means in Plain Terms
A café owner is fitting out a second premises. She puts in €75,000 of her own savings and takes a €25,000 bank loan at a fixed 6%. The savings aren't free money. She could have left it in a deposit account, and she's carrying the risk that the café fails and takes it with her. She wants a return on it, roughly 10% a year, and the bank wants 6% on its loan.
Two pots of money, two different costs. The blended cost of the pair is what the business has to clear on the money sitting in its espresso machines, its fridges and its shopfront.

Four words carry the idea. Weighted means the bigger pot counts for more: her €75,000 is 75% of the €100,000, so her expected return pulls harder on the answer than the bank's rate does. Average means the two costs are combined into one figure rather than kept in separate columns. Cost is what the funding costs the business, not an expense in the accounts. Her own capital never appears on a profit-and-loss statement, which is exactly why its cost gets forgotten. Capital is the long-term money tied up in the assets the business uses to trade.
Written as a rate, WACC is the one annual percentage a business must earn on the money invested in it. Clear it and the café pays its owner and its bank what they signed up for. Fall short and it is transferring value away from both: the owner's savings would have done better elsewhere, and the bank is lending to a business that isn't covering its costs.
The test in one line: if the return on a project can't beat the blended cost of the money funding it, the business is paying more for the capital than the capital earns.
Four groups reach for the number. Managers set a minimum return for new investment. Investors discount a company's future cash flows to value its shares. Analysts compare firms in the same industry, where a higher figure flags more risk. Regulators set the allowed return for utilities and airports, which is why the Irish Aviation Authority publishes a cost of capital determination at all.
The Formula and the Three Inputs Behind It
The blend has a standard written form:
WACC = (E/V × Re) + (D/V × Rd × (1 – Tc))
Read it as two halves. The first prices the equity, the second prices the debt and then trims it for the tax deduction that interest usually attracts. Every symbol has a plain meaning:
- E and D are the market values of equity and debt.
- V is E plus D, the total capital in the business.
- E/V and D/V are the weights, and they always add to 1.
- Re is the cost of equity, the return shareholders require.
- Rd is the pre-tax cost of debt, the rate lenders charge.
- Tc is the tax rate applied to the interest deduction.
Three inputs carry all the judgement. The cost of equity is the hardest and gets its own treatment below. The cost of debt looks like a fact until you ask which debt, at what date, fixed or floating. The tax rate looks fixed until you ask whether the company has profit to shield.
The tax shield isn't automatic. Interest is normally deductible, so the cost of debt is Rd × (1 – Tc). A 5% loan with a 25% tax rate costs 3.75% after tax, and on a large loan that saving is worth real money. It's worth nothing to a company with no taxable profit. A young firm carrying losses can't use the deduction, so the formula's flattering view of debt doesn't apply to it yet.
Weights belong at market value. Market prices show what shareholders and lenders require today; book equity is a historical residue of past share issues and retained profit. The gap matters most for a company whose share price has travelled a long way from its accounting value, or for a firm holding property bought decades ago.
The split between equity and debt isn't a law of nature either. Change it deliberately and you've made a capital structure decision, and the capital structure lesson shows how moving the weights shifts both the blended rate and the risk each funder carries.
| Component | Symbol | What it measures | Where the value usually comes from |
|---|---|---|---|
| Equity weight | E/V | Share of financing supplied by shareholders | Market value of shares outstanding |
| Debt weight | D/V | Share of financing supplied by lenders and bondholders | Market value of loans and bonds |
| Cost of equity | Re | Return shareholders require for the risk they carry | Capital asset pricing model or dividend growth model |
| Pre-tax cost of debt | Rd | Interest rate the company pays on borrowing | Bond yield or current loan rate |
| Tax rate | Tc | Share of profit taken by tax, which reduces the cost of debt | Statutory rate or the company's effective rate |
The concept map below sets the five pieces side by side so the structure is visible before any arithmetic starts.
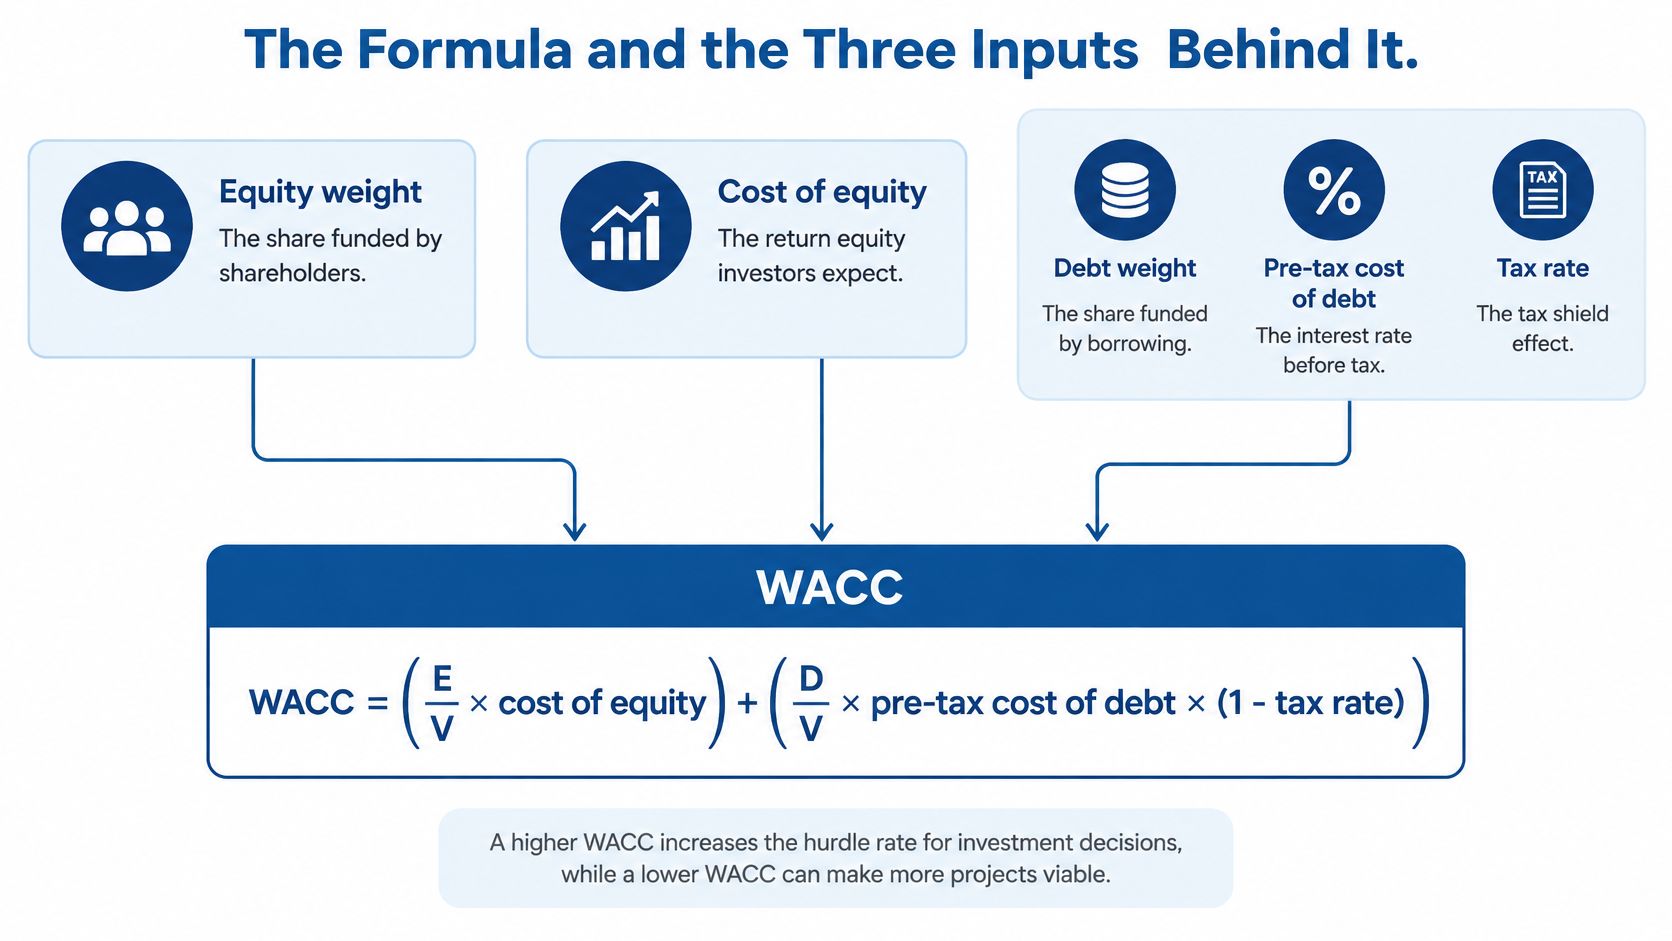
Before touching a calculator, give the café symbols. E is the owner's €75,000, D is the €25,000 loan, V is €100,000, so E/V is 75% and D/V is 25%. Re is the 10% she expects on her savings, Rd is the 6% the bank charges, and Tc is the rate she pays on profit. Once each symbol has a real number beside it, the formula stops looking like algebra and starts looking like her business.
Estimating Equity and Debt Costs in Practice
One of the two costs usually drops out of a spreadsheet cleanly. The other never does. Knowing which is which saves a lot of false confidence.
The cost of equity comes from a model, not a quote
Nobody sends an invoice for shareholder expectations, so you estimate them. The standard route is the capital asset pricing model:
Cost of equity = risk-free rate + (beta × market risk premium)
Put a risk-free rate of 3.5%, a beta of 1.2 and a market risk premium of 5% into it and you get 3.5% + 6.0% = 9.5%.
Beta measures how much a firm's share price moves relative to the wider market. A beta of 1.2 says the share has moved about 20% more than the market over the period measured, which raises the return shareholders demand. A beta below 1 dampens the swing.
Every input there is a choice. Which government bond, over what maturity, and which market premium all change the answer. Match the risk-free rate to the currency and the horizon of the cash flows, or the estimate drifts before you've started.
The cost of debt is easier, if you use today's rate
Work through the options in order of reliability:
- The yield on the company's traded bonds, which is a live market price and the cleanest evidence available.
- The rate on the most recent loan, but only if it still reflects what the market charges.
- The rate a bank would offer today for borrowing of a similar size, term and security.
The third is an estimate, but it beats an old contract. The gap between what a business already pays and what it would pay now is real: the SBCI Funding Pulse Report for Q3 2025 records an average reported cost of credit of 6.0% on outstanding SME loans in 2025, against 4.98% on new SME loan drawdowns in the third quarter of that year. Drop the older figure into the formula and you overstate the cost of debt by more than a percentage point.
Practical rule: if you can't point to the date and the source of the debt rate you're using, it's a guess wearing a number's clothes.
When there's no share price at all
Private companies still need a cost of equity, and the workaround is to borrow one. Take the betas of listed firms in the same industry, remove the effect of their debt to leave the pure business risk, then add back the debt level of the company being assessed. Their gearing isn't your gearing, so using their beta untouched would import someone else's financing decision.
Four sources cover most of the inputs: government bond yields for the risk-free rate, central bank data on lending rates, the company's accounts for its debt, and bank term sheets for what new borrowing would cost this month.
How to Calculate WACC Step by Step
The order of operations matters more than the arithmetic, because a mistake in step one can't be repaired in step five.
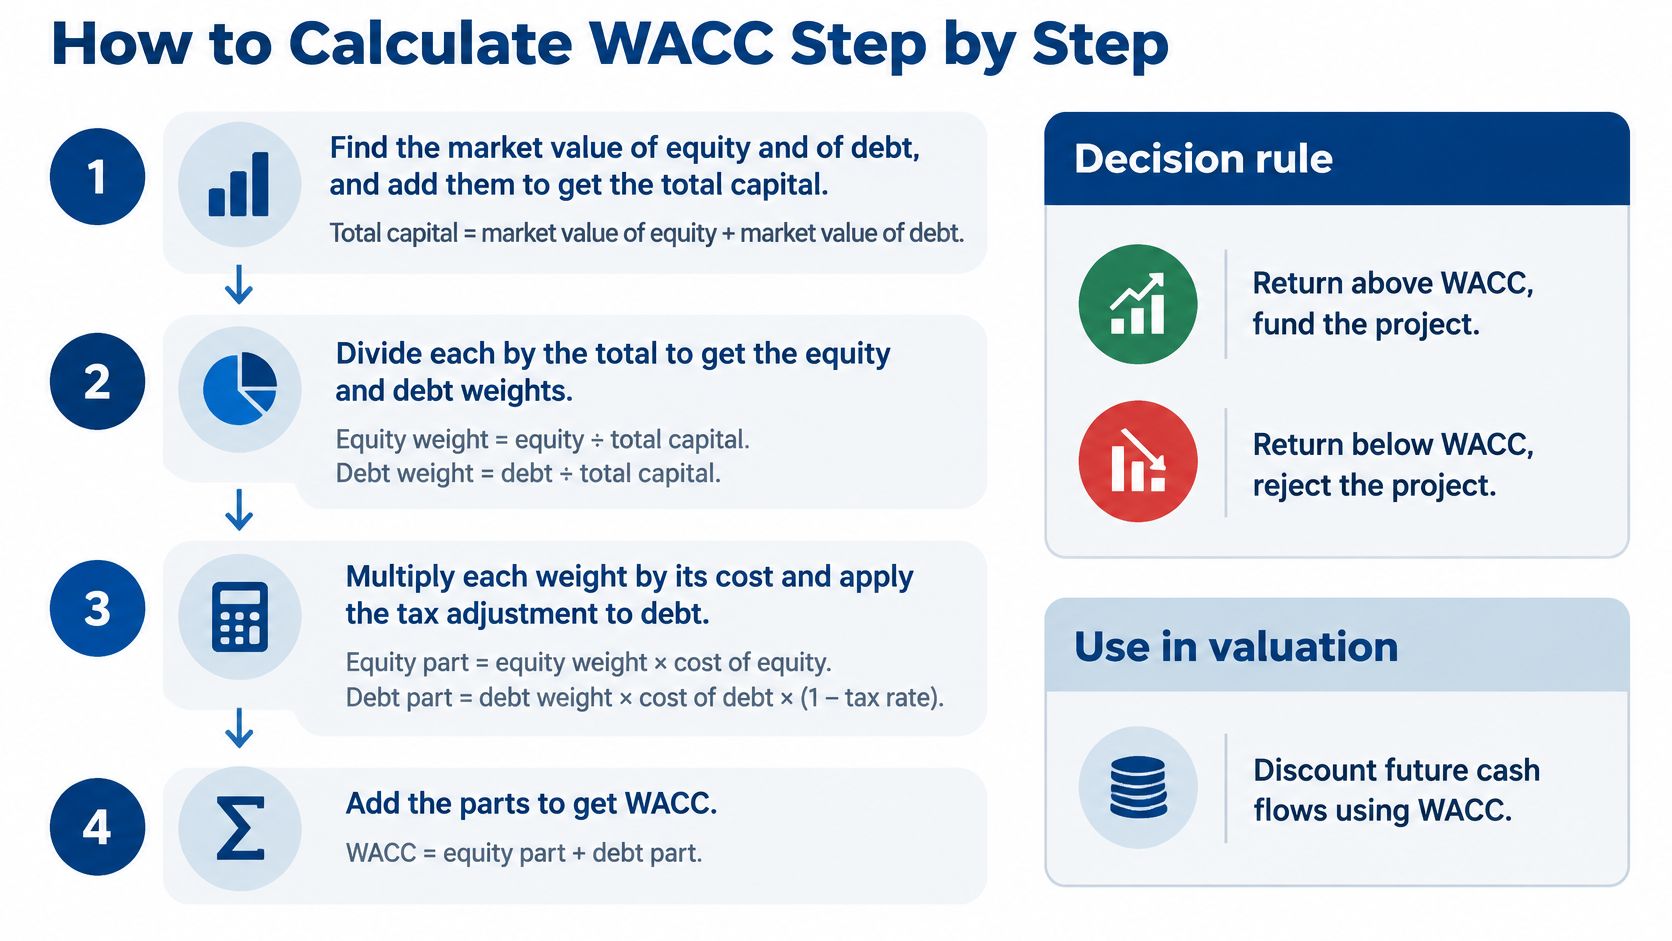
- Price both pots at market value. Take the market value of equity, then the market value of debt at what it would cost to settle today. Add them for total capital, V. Book values only belong here when no market price exists.
- Convert to weights. Divide each by V and check they sum to 1. If they don't, something has been left out of V, often a lease, a director's loan or an overdraft behaving like long-term funding.
- Estimate the cost of equity. The capital asset pricing model is the default route. For a private firm, borrow a listed peer's beta, strip out that peer's debt and relever at your own gearing.
- Set the pre-tax cost of debt, then apply tax. Multiply the rate by (1 – Tc) to get the after-tax figure. Use a tax rate the business can benefit from this year, not one it might use in three.
- Weight and add. Multiply each cost by its weight and add the two products. The output is an annual percentage.
- Stress the answer. Compare it with similar firms and re-run with each input a point or two either side. A rate that only works at one precise set of assumptions isn't a decision tool.
The arithmetic on a 60/40 company
Say a firm holds €600 million of equity and €400 million of debt. Shareholders require 10%, the bank charges 5% before tax, and the company pays 25% tax.
Equity contributes 60% × 10% = 6.00%. The after-tax cost of debt is 5% × (1 – 0.25) = 3.75%, and 40% × 3.75% = 1.50%. Add the halves and the WACC is 7.50%.
| Component | Weight | Rate | Contribution |
|---|---|---|---|
| Cost of equity | 60% | 10.00% | 6.00% |
| After-tax cost of debt (5.0% x (1 – 0.25)) | 40% | 3.75% | 1.50% |
| WACC | 100% | 7.50% |
Every euro of capital in that business must earn 7.50 cents a year before its funders have been paid what they asked for. A project returning 9% clears the bar. One returning 6% doesn't, however persuasive the sales forecast looks.
The process flow below compresses the same six steps into four boxes and adds the decision rule at the end.
The mistake that moves the answer most
Reaching for the equity line in the accounts instead of the share price is the slip that shows up again and again. A company trading well above book value gets a debt weight that is too high, which drags the WACC down, which makes marginal projects look acceptable. The error flatters the decision, and that's why it survives: nobody re-runs a project they've already approved.
Building the model properly, with the debt schedule and the tax line in the right cells, is the craft covered in the financial modelling lesson.
Using WACC to Judge Investments and Valuations
Once you have a rate, it becomes a hurdle. A project earns its place only if its expected return clears the cost of the money that funds it.
| Project return against WACC | Likely decision | Effect on value |
|---|---|---|
| Above WACC | Accept | Adds value above the required return |
| Equal to WACC | Neutral or defer | Earns only the required return |
| Below WACC | Reject or rethink | Reduces value for funders |
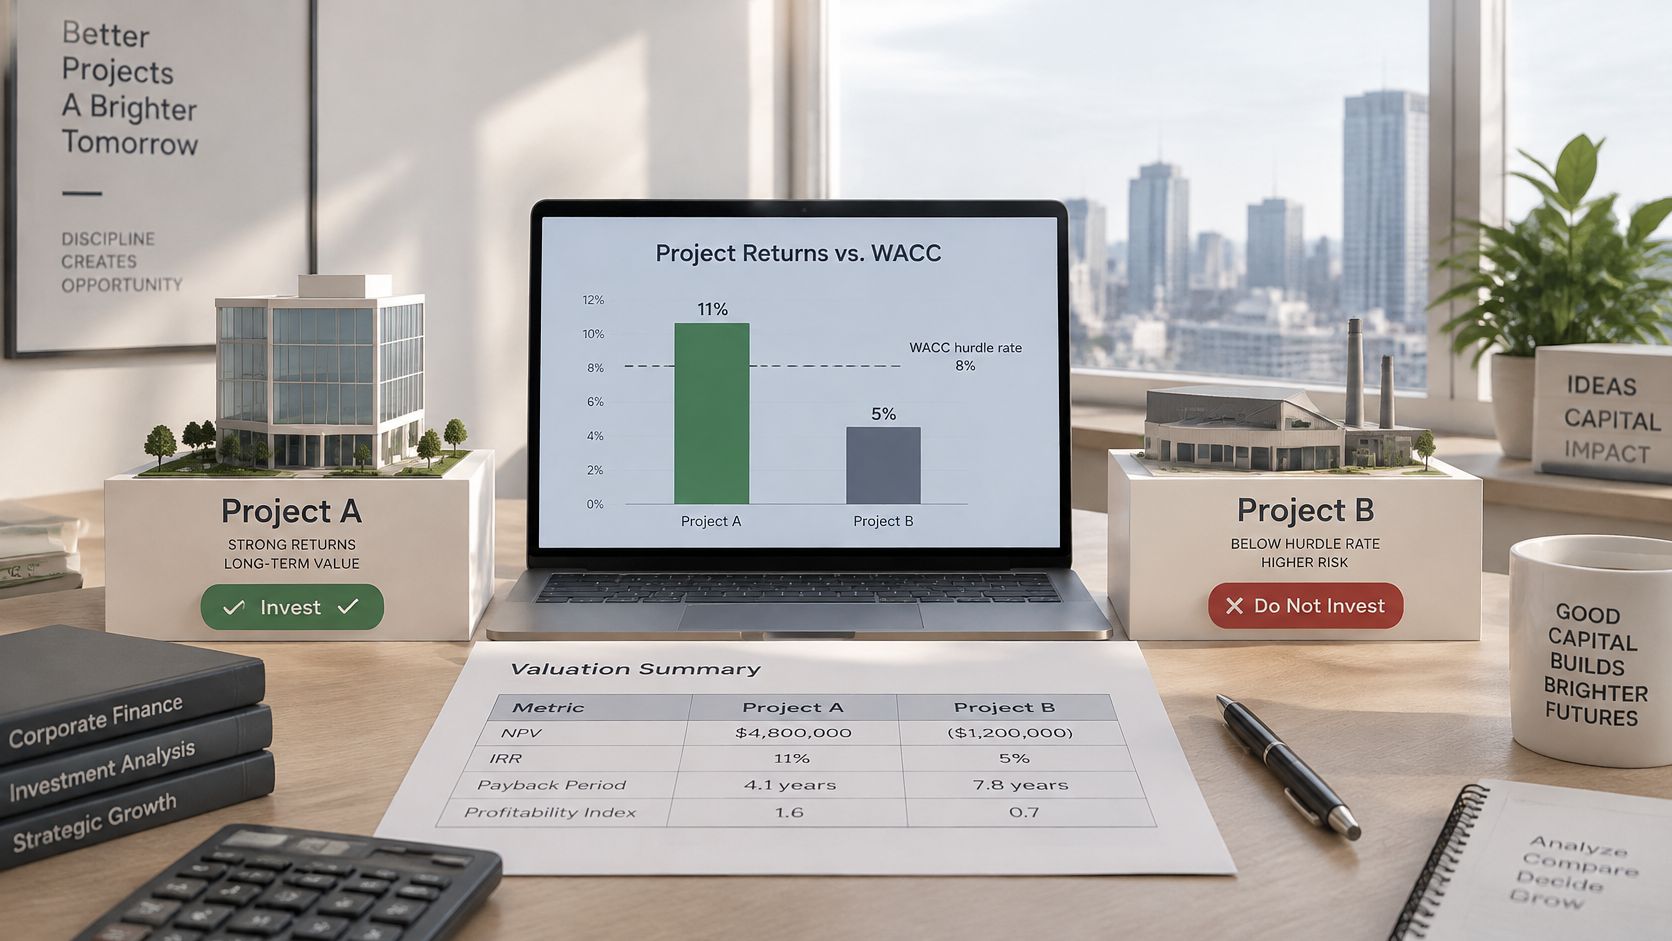
Put numbers behind the rule. A project costs €1,000,000 and returns €300,000 a year for five years. Discount those five receipts at an 8% WACC and their present value comes to about €1,197,810. Subtract the outlay and the net present value is roughly €197,810, a positive result that says the project adds value above what the funders require.
The €197,810 is the margin by which the project beats what equity holders and lenders could earn elsewhere. Positive NPV is that margin expressed in present value terms, which is why a positive figure, however small, justifies the project on financial grounds and a negative one sinks it.
Before you discount: confirm the rate and the cash flows describe the same risk and sit in the same currency.
Match the rate to the project, not the letterhead
A company-wide WACC suits projects of similar risk to the firm's usual activities. It fits poorly when a project sits far from the core business. A speculative new product line needs a higher rate, because its cash flows are less certain, and a like-for-like replacement of an existing machine can justify a lower one.
Discounting a risky venture at the same rate as the steady core business treats the two as carrying identical risk. That assumption usually flatters the venture, because the risky option is often the one its sponsors want approved.
Valuation analysts apply the same logic to a whole company: project its expected future cash flows, discount them at the WACC, and the result is an estimate of what the business is worth today. When several projects compete for the same capital, the capital budgeting lesson shows how this single hurdle ranks them against each other.
A higher rate lowers that value, which is why a valuation is only as strong as the discount rate beneath it. Because the rate itself is assembled from judgements about weights, borrowing costs and tax, the honest output is a range rather than a single figure. A value that survives a slightly higher and slightly lower rate deserves confidence; one that flips sign on a small move deserves a second look.
Where WACC Estimates Go Wrong and How to Check It
The temptation is to quote the number to two decimal places and move on. Test that instinct on the project above by raising the discount rate from 8% to 10%. The present value of the five €300,000 receipts falls to about €1,137,240 and the net present value to about €137,240.
The project still clears its cost, but a third of the apparent value has vanished. Nothing about the project changed. Only a rate that nobody can measure exactly moved by two points. That is why a WACC works better as a range than as a verdict: every input behind it is an estimate, and small judgement calls compound into a different answer.
Regulators live with that spread in public. The IAA cost of capital draft report records a draft real pre-tax WACC of 4.56% for Dublin Airport's 2026 determination, against 4.35% in 2022 and 4.22% in 2019, and the same determination process produced a pre-tax range of 5.81% to 6.84% with a 6.32% midpoint. Those differences come from gearing, beta, risk-free rates, equity risk premiums, inflation and tax. Each choice is defensible on its own, which is why two careful analysts can land a full point apart.
Four traps that shift the answer
- Book values in the weights. Using balance-sheet figures weights the formula by what the firm used to own, so a company whose share price has climbed looks more debt-heavy than it is.
- A stale debt rate. Borrowing priced years ago flatters the WACC whenever market rates have risen since, and the answer comes out lower than today's funding costs justify.
- A tax shield the company can't use. Deducting interest saves nothing when there is no taxable profit to deduct it against, so assuming the full shield overstates the benefit of debt.
- One rate for every project. A single figure applied across ventures of different risk sets the bar too low for the riskiest proposals and too high for the safest, skewing both decisions at once.
Accounting Principles, a course at the European Institute of Leadership and Management, is built for business owners, students of business and finance, and professionals moving into accounting or finance roles, which is where the balance-sheet side of these judgements gets properly grounded.
A five-point check before you use the number
- Confirm equity and debt are weighted at market value.
- Check the cost of debt reflects borrowing available today.
- Confirm the tax rate matches whether the company can use the interest deduction.
- Test the result one to two percentage points either side and see whether the decision flips.
- Apply a company-wide WACC only to projects of similar risk.
Sensitivity testing is a discipline in its own right, and the managing investment risk lesson covers how to structure it.
The European Institute of Leadership and Management teaches these ideas in a self-paced online format, and its Mini-MBA Financial Management Programme covers financial concepts, accounting principles, investment fundamentals, economics and international business. If you want to stop assembling discount rates from fragments and learn the whole framework properly, start at European Institute of Leadership and Management.